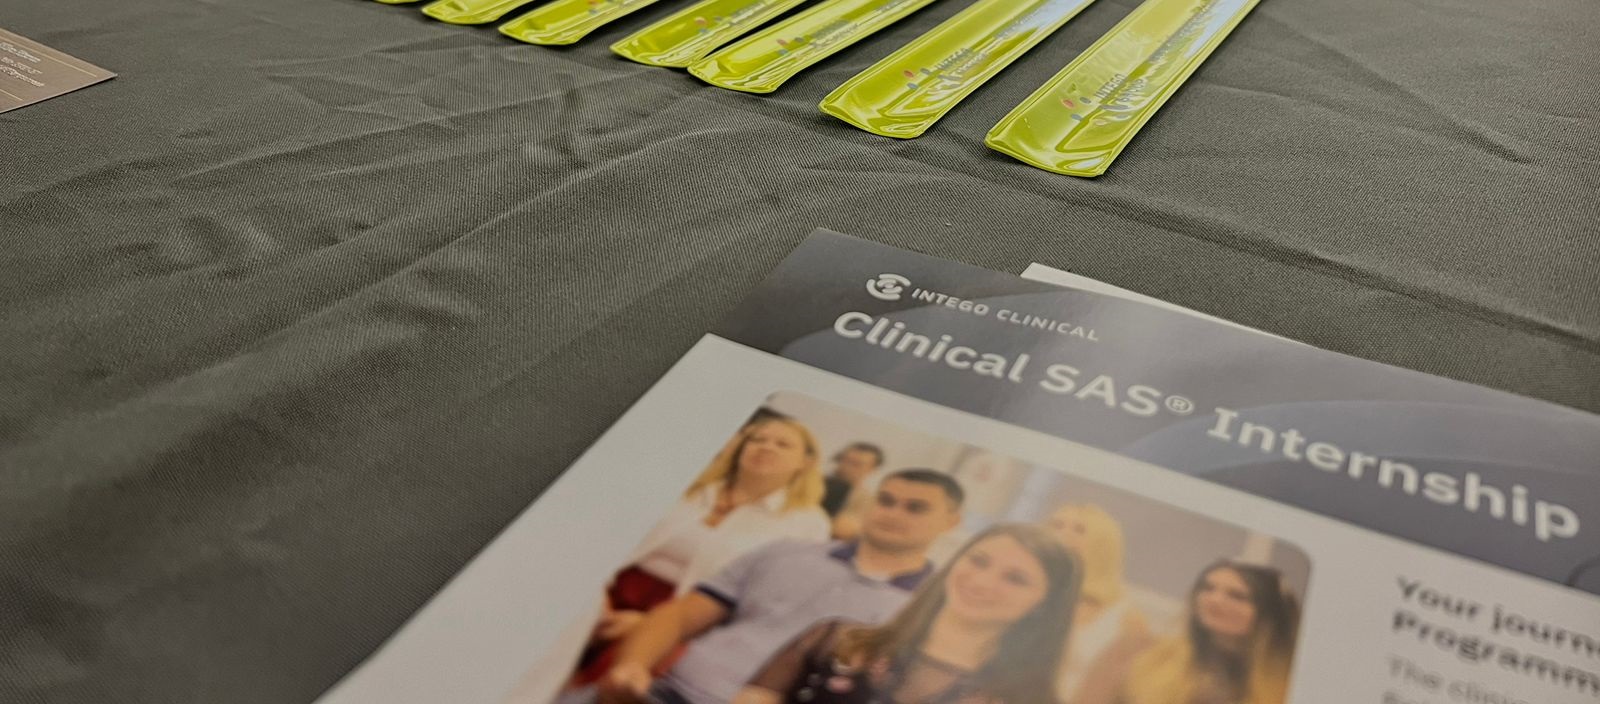
A Powerful and Moving Experience at PHUSE US Connect 2022
Intego Clinical was proud to support and participate in PHUSE US Connect 2022! This year’s event was incredibly special for our team and we’re excited to share the outcome and experience with you.
What is PHUSE?
Founded in 2004, PHUSE is a global community of people and organizations focused on sharing ideas, tools and standards around data, statistical and reporting technologies to advance the future of life sciences.
PHUSE US/EU Connect
Twice a year, the organization hosts PHUSE Connect, a multi-day event that takes place in both Europe and the US. The event includes 100 unique presentations, discussion clubs, hands-on workshops and professional speakers.
For the last 6 years, Intego Clinical and our staff have participated as sponsors, attendees and presenters on a number of topics around life sciences.
PHUSE US Connect was particularly special as it was the first in-person event held in the last 2 years and included the PHUSE/FDA Innovation Challenge, a definite highlight of the event and something Intego Clinical participated in. This year, the event was held in Atlanta, GA at the Atlanta Marriott Marquis.
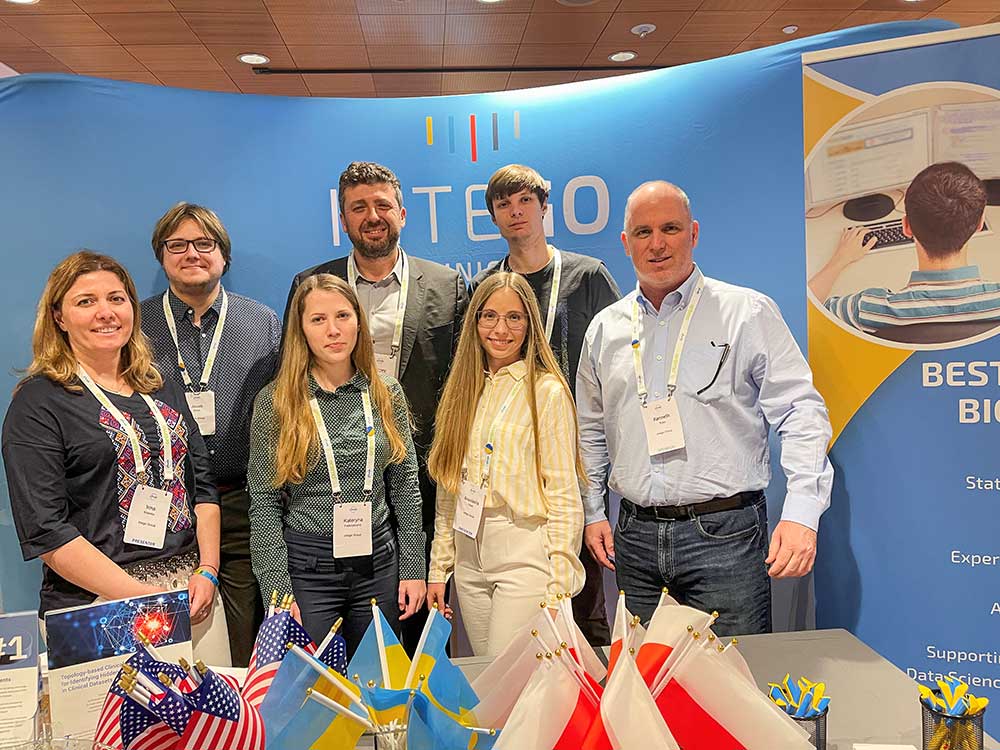
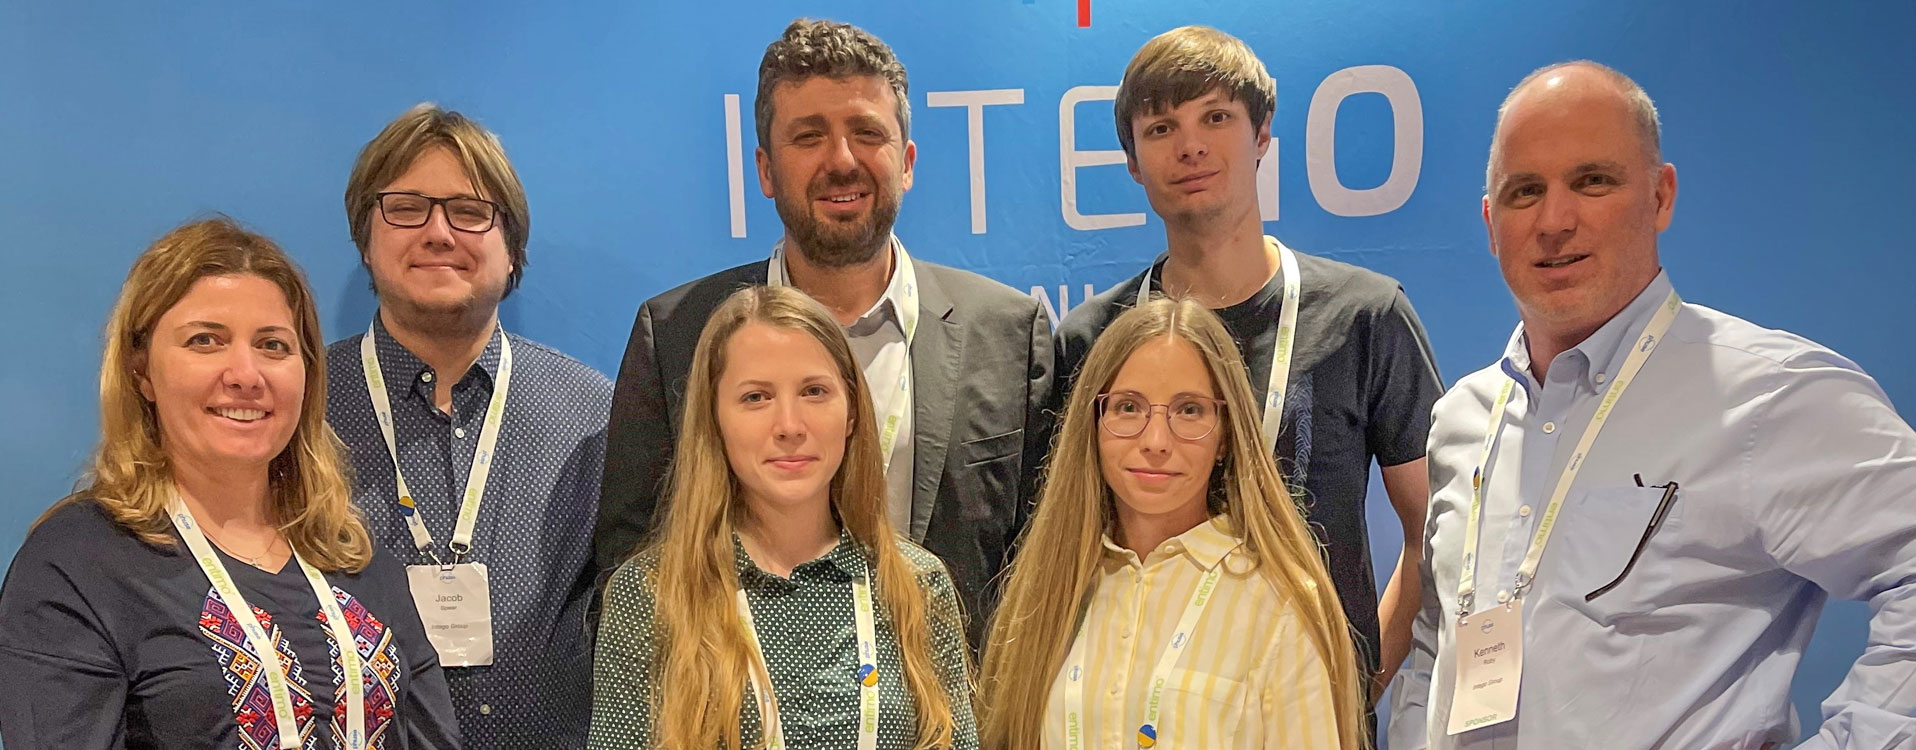
PHUSE US Connect Presenters from Intego Clinical
Intego Clinical delivered six presentations at the event which included a total of nine of our team members from our three offices in Central Florida, Ukraine and Poland. With the current situation going on in Ukraine, three of the nine members were unable to attend physically, but did so virtually through Zoom.
An Unexpected and Powerful Moment
With three of our team members from Ukraine, unable to attend, their presentations were delivered through a pre-recorded video. However, right before the Keynote speaker took to the stage, all three of the presenters were brought in via Zoom as a show of support for them and Ukraine. Once connected, over 500 people in the audience erupted into applause which lasted for a few minutes. It was a powerful and moving experience we will never forget.
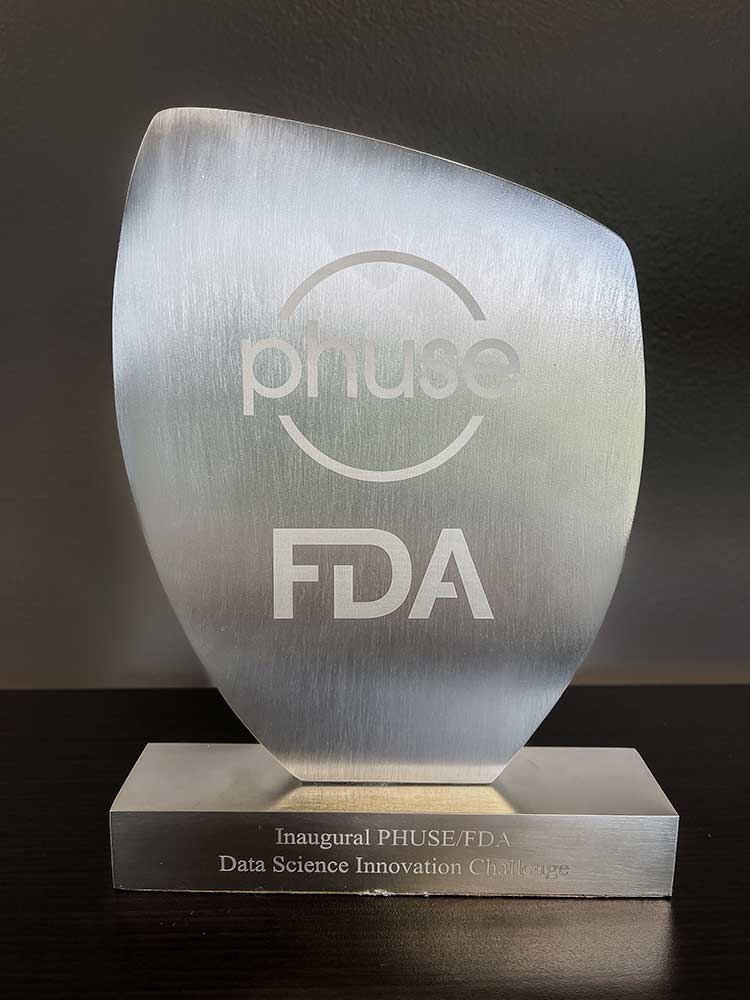
Winning the PHUSE/FDA Data Science Innovation Challenge!
We’re excited to share that with the support of Intego Clinical’s team of Data Scientists and their research in the areas of modern machine learning algorithms and data visualization techniques, Kostiantyn Drach and Sergey Glushakov brought home the PHUSE/FDA Innovation Challenge award! Congratulations to all involved!
Learn more about our data science services
Below are a list of the presenters and topics delivered at PHUSE US Connect 2022
Reassure Your Assumptions Using Sensitivity Analysis
Vadim Kalinichenko (Ukraine)
Statistical methods in clinical trials always rely on different kinds of assumptions. But how could you ensure that assumption is appropriate and obtained results are robust? The answer is implementing sensitivity analysis which applies statistical methods for evaluating the strength of conclusions based on clinical trial data by reanalyzing the outcome using alternative assumptions. It plays a key role in assessing the robustness of the results and conclusions based on primary analyses of data in clinical trials. This is a comprehensive way to assess the effect, impact, and influence of the main assumptions. Sensitivity analysis is also crucially important in interpreting or establishing credibility of the findings and understanding validity of the chosen statistical analysis in general. This paper reviews various methods for conducting sensitivity analysis with the main focus on the impact of the missing data. It illustrates common scenarios and the most appropriate ways of dealing with them.
Using the Geometric Properties of Datasets to Analyze the Accuracy of COVID-19 Forecasting Models
Kostiantyn Drach (Austria)
Iryna Kotenko (Ukraine)
Due to the variety of data sources that are currently available to forecast COVID-19 developments, it is critical to assess the accuracy of the employed models. In this paper, we analyze multiple forecasting models that the CDC recommends to predict the pandemic spread within the US. Our studies relied on geometric properties of data to assess the prediction accuracy for every model over a specific time period. For each model, we constructed a graph using the machine learning technique for time series (various open-source solutions). In this graph, every node represents a snapshot of the time series with forecasted results within a specific timeframe while the edge connects two nodes if they are similar in terms of the behavior exhibited within corresponding timeframes. Building multiple graphs for each model allowed us to develop a ranking system for forecasting models and identify dependencies between data geometry and prediction accuracy.
Identifying Signals and Similarities in Multiple Datasets Using Graph-based Machine Learning Algorithm
Kostiantyn Drach (Austria)
Sergey Glushakov (USA)
This proposal leverages a novel approach involving the pure geometric properties within datasets to reveal hidden patterns. It relies on a combination of biostatistics, topological data analysis, visualization, and machine learning. First, a cloud of graphs is extracted from the original dataset in which every node represents one subject while two nodes are connected with the edge if they are similar in terms of various predefined features. A subset of graphs from the cloud with the most robust geometric properties is subsequently revealed. Next, for every graph from the subset, machine learning algorithms discover communities of subjects relying on pure geometric properties alone. Finally, the highlighted communities are compared based on the various features employed by the model, such as demographics, ethnicity, social factors, etc.
Does My Skill Set Still Meet the Needs of the Market?
Dmytro Skorba (Ukraine)
Having been in the industry for about a decade, I began to wonder more and more if my skill set would meet the new market expectations. Having traveled the career development path from a student in a training program to a leading statistical programmer in the company, I am now at the point where I need to consider which direction to go next to continue my development. In this article, I would like to share my thoughts on the options for a clinical SAS programmer’s career development, the relevance of certain technologies, and current market needs. It also would be interesting to compare the profiles and requirements for clinical programmers of the present versus 10 years ago and to discourse a little about the direction in which the industry will develop.
Trial Design Datasets in Oncology Clinical Trials
Anastasiia Drach (Austria)
Trial Design Model (TDM) defines a standard structure that accommodates data about study design, planned activities, treatment arms, etc. These datasets have a certain structure that is different from the rest of SDTM datasets and may be confusing at first. Additionally, some aspects that are specific to oncology don’t always fit perfectly into the TDM. In this presentation we will discuss potential issues in implementation of these standards for oncology clinical trials and their possible solutions, including some macros that can help us along the way. We will provide examples of complex study designs and treatment plans and their representation in TDM. This talk will also cover the Trial Disease Assessments Dataset (TD) that was designed specifically with oncology data in mind. This dataset enables the study team to capture a more complicated visit schedule and helps to compare planned schedule of assessments with their actual occurrences.
SAS Features We Underestimate
Andrii Borzenkov (Ukraine)
SAS is a vast software for data analysis that contains a lot of features for different needs. Only a small part of it is usually being used for clinical research. However, there are possibilities that can unexpectedly improve ease and convenience of work with the data. This paper provides an overview of SAS features that are being used rarely, but still are useful for efficient study data analysis. We give examples showing how to minimize RAM/CPU usage while working with data sets of big size, how to adjust output styles with min. program adjustments, how to create interactive outputs using SAS code.